Welcome to BKPOWER!

What is Power Factor?
TIPS:Power factor measures how effectively electrical power converts into useful work in AC circuits. Power factor correction reduces reactive power waste, cuts utility penalties by up to 25%, and extends equipment lifespan. For industrial facilities with motors, transformers, and UPS systems, improving power factor from 0.80 to 0.95 can eliminate thousands in annual penalty charges while releasing up to 20% additional electrical capacity.
I. Understanding Power Factor: The Foundation of Electrical Efficiency
1. What Is Power Factor?
Power factor (PF) is a dimensionless number between 0 and 1. It measures the ratio of real power to apparent power in an alternating current (AC) circuit. Real power performs actual work. Apparent power represents the total power the system must deliver.
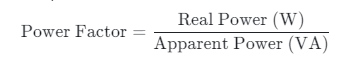
The formula is simple:
Power Factor = Real Power (kW) ÷ Apparent Power (kVA)
A power factor of 1.0 (unity) means all supplied power performs useful work. A power factor of 0.80 means 20% of the power capacity is wasted as reactive power.
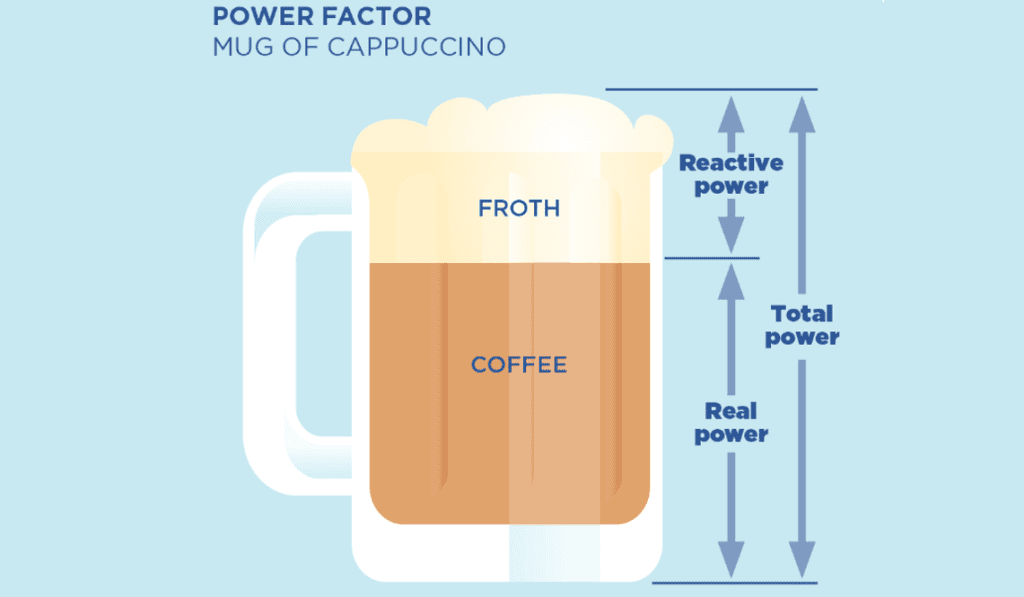
[IMAGE 1: Power Factor Cappuccino Analogy]
Think of power factor like a cappuccino. The coffee is real power. The froth is reactive power. The full mug is apparent power. You pay for the full mug. You only drink the coffee. Power factor correction removes the froth.
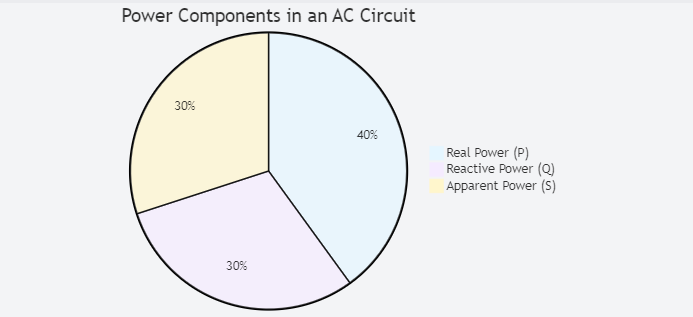
2. The Three Types of Electrical Power
Every AC circuit contains three power components:
Real Power (P) — measured in kilowatts (kW). This power performs actual work. It runs motors, lights, heaters, and computers. You pay for real power in kilowatt-hours (kWh).
Reactive Power (Q) — measured in kilovolt-amperes reactive (kVAR). This power creates magnetic fields in inductive equipment. It does no useful work. But the electrical system must still deliver it. Reactive power oscillates between source and load.
Apparent Power (S) — measured in kilovolt-amperes (kVA). This is the vector sum of real and reactive power. It represents the total power the generator, transformer, and cables must handle.
3. The Power Triangle
Engineers visualize these relationships using the power triangle. Real power forms the horizontal base. Reactive power forms the vertical side. Apparent power is the hypotenuse.
The relationship follows the Pythagorean theorem:
S² = P² + Q²
This triangle shows why low power factor is costly. For the same real power (P), higher reactive power (Q) increases apparent power (S). The electrical infrastructure must be sized for S, not just P.
4. Power Factor Ranges and What They Mean
| Power Factor | Rating | Typical Impact |
|---|---|---|
| 1.00 | Perfect | Resistive loads only (rare in industry) |
| 0.95–0.99 | Excellent | Industry target; avoids all penalties |
| 0.90–0.94 | Good | Above most penalty thresholds |
| 0.85–0.89 | Fair | May trigger penalties with strict utilities |
| 0.70–0.84 | Poor | Significant penalties and energy waste |
| Below 0.70 | Critical | Severe inefficiency; immediate action required |
Most uncorrected industrial facilities operate between 0.75 and 0.85 power factor. This creates substantial hidden costs.
II. Why Power Factor Matters: The Business Case for Correction
1. Financial Impact: Utility Penalties and Demand Charges
Utilities worldwide penalize poor power factor. Common penalty thresholds range from 0.85 to 0.95. When your facility drops below the threshold, penalties apply.
Penalty calculation methods vary:
Method A: Adjusted Demand Charge
- Formula: Adjusted Demand = Actual Demand × (Threshold PF ÷ Actual PF)
- Example: 500 kW demand at 0.80 PF with 0.90 threshold
- Adjusted demand: 500 × (0.90 ÷ 0.80) = 562.5 kW
- Excess demand: 62.5 kW
- At $12/kW demand rate: $750/month penalty = $9,000/year
Method B: Excess kVAR Charge
- Utilities charge $2–8 per excess kVAR monthly
- A facility with 150 kW at 0.72 PF generates 145 kVAR
- Allowed at 0.85 threshold: 93 kVAR
- Excess: 52 kVAR
- At $0.10/kVAR: $5.28/month = $63/year (small facility)
For medium factories (600 kW), penalties can reach $20,000 annually.
2. Equipment Impact: Overheating and Reduced Lifespan
Low power factor increases current flow for the same real power. Higher current causes:
- Excess heat in conductors — I²R losses increase dramatically
- Transformer overload — sizing must increase by 20–40%
- Motor overheating — insulation degrades faster
- Breaker nuisance tripping — higher currents trigger protective devices
- Voltage drops — sensitive equipment malfunctions
A facility with 0.70 power factor draws 43% more current than the same facility at 0.95 PF. This nearly doubles line losses.
3. Grid Impact: System Capacity and Stability
Low power factor reduces the effective capacity of the entire electrical grid:
- A 1,000 kVA transformer delivers only 700 kW at 0.70 PF
- The same transformer delivers 950 kW at 0.95 PF
- That is 36% more usable capacity without replacing equipment
Utilities pass these infrastructure costs to consumers through penalties. Correcting power factor benefits both the facility and the broader grid.
III. What Causes Low Power Factor? Identifying the Culprits
1. Inductive Loads: The Primary Offenders
Inductive equipment requires reactive power to create magnetic fields:
- Induction motors — typically 0.75–0.85 PF at full load; worse at partial load
- Transformers — especially oversized units running lightly loaded
- Welding equipment — highly inductive, very poor PF
- Fluorescent lighting ballasts — older magnetic ballasts run 0.50–0.60 PF
- Arc furnaces — among the worst industrial loads for power factor
2. Variable Frequency Drives (VFDs) and Harmonics
Modern facilities use VFDs for motor control. While VFDs improve process control, they introduce harmonics. Harmonics interact with capacitor banks, creating resonance problems.
When adding capacitors to a network with harmonics:
- Capacitive impedance interacts with inductive supply impedance
- At parallel resonant frequency, impedance peaks dramatically
- If resonant frequency matches a harmonic (5th, 7th, 11th), distortion amplifies
- Result: damaged capacitors, blown fuses, voltage distortion
Solution: Use detuned reactors (series inductors) sized to push resonant frequency below the 5th harmonic (below 250 Hz on 50 Hz systems).
3. UPS Systems and Power Factor
UPS systems affect power factor in two ways:
Input Power Factor: How the UPS draws power from the utility. Modern rectifiers achieve ≥0.99 input PF. Legacy systems may draw 0.60–0.80 input PF, creating upstream problems.
Output Power Factor: How much real power the UPS can deliver. Legacy UPS rated at 0.8 PF means a 100 kVA unit delivers only 80 kW. Modern unity PF (1.0) UPS delivers 100 kW from the same 100 kVA — 25% more usable capacity.
BKPOWER’s high-frequency online UPS series features:
- Input power factor >0.99 (with filter)
- Output power factor 0.8–1.0 depending on model
- Double-conversion topology for complete isolation
- THDv <2% with linear loads
IV. How to Improve Power Factor: Proven Correction Methods
1. Capacitor Banks: The Standard Solution
Capacitors are the most common power factor correction method. They supply leading reactive power to cancel lagging reactive power from inductive loads.
Sizing Formula:
kVAR needed = kW × (tan θ₁ − tan θ₂)
Where:
θ₁ = arccos(current PF)
θ₂ = arccos(target PF)
Example: Improve 500 kW load from 0.80 to 0.95 PF
- tan(36.87°) = 0.750
- tan(18.19°) = 0.329
- kVAR = 500 × (0.750 − 0.329) = 210.5 kVAR
- Select next standard size: 225 kVAR
2. Fixed vs. Automatic Capacitor Banks
| Feature | Fixed Banks | Automatic Banks |
|---|---|---|
| Cost | $15–25/kVAR | $40–60/kVAR |
| Output | Constant kVAR | Switched steps |
| Best For | Constant loads | Variable loads |
| Risk | Overcorrection at light loads | None (auto-adjusting) |
| Payback | 6–18 months | 12–24 months |
Selection Rule:
- Load variation <10% → Fixed bank
- Load variation >20% → Automatic bank
- Multiple shifts with different loads → Automatic bank

3. Installation Location Strategies
Centralized (Main Service):
- Single bank at main distribution
- Simple installation and maintenance
- Lower cost
- Best for small-medium facilities (<1,000 kW)
Distributed (Load Centers):
- Multiple smaller banks at distribution panels
- Reduces feeder currents and I²R losses
- Better voltage regulation
- Best for large facilities with distributed loads
Load-Specific (At Motors):
- Individual capacitors at large motors (>50 HP)
- Most efficient correction at source
- Reduces motor feeder current
- Best for facilities with few large motors
4. Active Power Factor Correction
For facilities with severe harmonic content, active PFC systems offer:
- Real-time reactive power compensation
- Harmonic filtering capability
- No resonance risk
- Dynamic response to load changes
Active systems cost $200–400/kVAR but provide comprehensive power quality improvement. Payback extends to 36–60 months but includes harmonic mitigation benefits.
V. BKPOWER Solutions: Integrated Power Factor Management
1. UPS Systems with Built-In PFC
BKPOWER’s UPS portfolio addresses power factor at multiple levels:
High-Frequency Online UPS (BK-L11 Series):
- 1–10 kVA single-phase models
- Input PF >0.99 with active PFC
- Double-conversion topology
- Compact design for office and light industrial
Industrial Frequency UPS (BK-G33 Series):
- 10–800 kVA three-phase models
- Strong electrical isolation
- High output power quality
- Designed for harsh industrial environments
Modular UPS Systems:
- Scalable from 20 kVA to 1,000+ kVA
- Hot-swappable modules
- N+1 redundancy option
- Ideal for data centers and critical infrastructure

2. Power Factor Correction Capacitor Banks
BKPOWER offers:
- Fixed capacitor banks for constant loads
- Automatic capacitor banks with digital controllers
- Detuned capacitor banks with series reactors for harmonic-rich environments
- Custom-engineered solutions for specific facility requirements
3. Integrated Energy Management
BKPOWER’s approach combines:
- Power quality analysis and measurement
- Capacitor bank sizing and installation
- UPS system integration
- Ongoing monitoring and maintenance
This integrated approach ensures optimal power factor across the entire facility, not just at individual points.
VI. Calculating Your Power Factor Correction ROI
1. Step-by-Step ROI Calculation
Step 1: Measure Current Power Factor
- Use utility bills (kW and kVA readings)
- Or install a power quality analyzer for 1–4 weeks
- Measure at peak demand times, not just average
Step 2: Calculate Current Penalties
- Identify utility threshold (typically 0.85–0.95)
- Apply utility’s penalty formula
- Annual penalty = Monthly penalty × 12
Step 3: Determine Target Power Factor
- 0.95 is the standard industry target
- Provides margin above penalty thresholds
- Avoids overcorrection risk
Step 4: Size Capacitor Bank
- Use kVAR formula above
- Round up to next standard size
- Verify resulting PF is 0.95–0.98
Step 5: Calculate Investment and Payback
Payback (months) = Installation Cost ÷ (Annual Penalty Savings − Annual Maintenance)Example:
- Current penalty: $12,000/year
- Capacitor installation: $18,000
- Annual maintenance: $500
- Annual savings: $12,000 − $500 = $11,500
- Payback: $18,000 ÷ $11,500 = 1.57 years (19 months)
- 10-year ROI: 539%
2. Hidden Savings Beyond Penalty Elimination
Power factor correction delivers benefits beyond direct penalty savings:
| Benefit | Typical Value |
|---|---|
| Reduced line losses | 15–25% reduction |
| Released transformer capacity | 20–35% more usable kVA |
| Extended equipment life | 30–50% longer motor/transformer life |
| Reduced cooling costs | Lower I²R heat generation |
| Improved voltage stability | Better equipment performance |
3. Market Context
The global power factor correction market reached $2.45 billion in 2026, growing at 6.5% CAGR. Key drivers include:
- Rising energy costs
- Stricter utility penalty structures
- Data center expansion (fastest-growing segment at 8.7% CAGR)
- Industrial automation growth
- Regulatory compliance requirements (EU EN 50160, US DOE standards)
Asia Pacific dominates with 41.3% market share, driven by rapid industrialization in China and India.
VII. Conclusion: Take Action on Power Factor Today
Power factor is not just an engineering metric. It is a direct measure of electrical efficiency and a significant cost factor for industrial and commercial facilities.
Key takeaways:
- Low power factor wastes capacity and triggers utility penalties
- Correction to 0.95 PF eliminates penalties and releases infrastructure capacity
- Capacitor banks offer 6–24 month payback periods
- Modern UPS systems with unity PF maximize usable capacity
- Harmonic-rich environments require detuned or active solutions
BKPOWER provides comprehensive power factor correction solutions. From capacitor banks to high-efficiency UPS systems, we help facilities optimize power quality, reduce costs, and extend equipment life.
Contact BKPOWER today for a free power factor assessment and customized correction proposal.
Internal Links
- Explore BKPOWER UPS systems for your facility
- Learn about high-frequency online UPS specifications
- Discover industrial frequency UPS for heavy-duty applications
- View modular UPS for data centers scalable solutions
- Check voltage stabilizer solutions for power quality
- Read more about power factor correction services
References Source
| Organization | URL |
|---|---|
| IEEE (Institute of Electrical and Electronics Engineers) | https://www.ieee.org |
| IEC (International Electrotechnical Commission) | https://www.iec.ch |
| U.S. Department of Energy | https://www.energy.gov |
| CENELEC (European Committee for Electrotechnical Standardization) | https://www.cenelec.eu |
| NEMA (National Electrical Manufacturers Association) | https://www.nema.org |
FAQ
What is a good power factor for industrial facilities?
A: A power factor of 0.95 or higher is considered excellent for industrial facilities. Most utilities set penalty thresholds between 0.85 and 0.90. Facilities operating below 0.85 typically face significant utility penalties and should implement power factor correction immediately.
How much can power factor correction save on electricity bills?
A: Industrial facilities can save between $2,000 and $50,000+ annually depending on facility size and utility rate structure. A 500 kW facility with 0.80 power factor paying $12/kW demand charges faces approximately $9,000 in annual penalties. Correction to 0.95 eliminates these charges entirely.
What causes low power factor in electrical systems?
A: Low power factor is primarily caused by inductive loads including electric motors, transformers, welding equipment, fluorescent lighting ballasts, and some UPS systems. These devices require reactive power to create magnetic fields, which increases apparent power without performing useful work.
Can UPS systems improve power factor?
A: Yes. Modern online double-conversion UPS systems with unity power factor (1.0 PF) output can deliver 25% more usable real power compared to legacy 0.8 PF systems. BKPOWER’s high-frequency online UPS series features active power factor correction with input PF >0.99, reducing upstream infrastructure requirements.
What is the ROI timeline for power factor correction equipment?
A: Fixed capacitor banks typically pay back in 6-18 months, while automatic switched banks require 12-24 months. The global power factor correction market reached $2.45 billion in 2026, growing at 6.5% CAGR, driven by rapid ROI and regulatory compliance requirements.