Welcome to BKPOWER!












Optimizing Industrial UPS Infrastructure with 0.99 Input Power Factor
TIPS:Engineering teams face critical decisions when sizing industrial UPS infrastructure. Input power factor determines transformer ratings, cable sizing, and generator capacity. Modern industrial power UPS systems using 0.99 PFC technology reduce input current by 19% compared to traditional 0.8 PF designs. This article provides practical sizing calculations and ROI analysis for deploying high power factor UPS across data centers, manufacturing, and healthcare facilities.
Ⅰ. Introduction
Engineering specifications for industrial UPS systems must address power factor from day one. The difference between 0.8 and 0.99 input power factor translates to real infrastructure costs. Transformers, generators, circuit breakers, and cables all require upsizing for poor power factor.
Modern industrial power UPS with active PFC eliminates these penalties. However, many engineering teams still size systems using outdated assumptions. This leads to oversized infrastructure and wasted capital.
This article provides practical sizing methodologies for 0.99 PFC UPS deployments. We examine transformer and generator sizing calculations. We analyze IEEE 519 compliance requirements. Real-world case studies demonstrate ROI across data center, manufacturing, and healthcare applications.
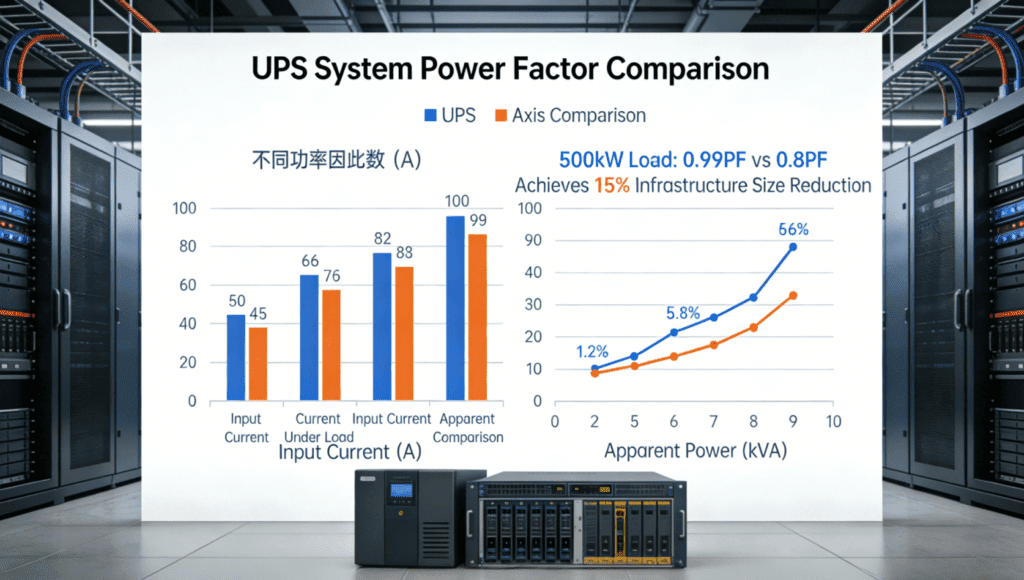
Figure 1: Input current and kVA requirements comparing 0.8 PF vs 0.99 PF UPS systems. Note the 19% reduction in infrastructure sizing at 500kW.
Ⅱ. Sizing Calculations for Modern UPS Infrastructure
1. Transformer Sizing Methodology
Transformer capacity derives from apparent power requirements. The formula is straightforward: kVA = kW / Power Factor. However, the power factor choice dramatically affects results.
Consider a 500kW critical load. Traditional UPS achieves 0.8 input power factor. The calculation yields 625 kVA transformer requirement (500 / 0.8). Modern 0.99 PFC UPS reduces this to 505 kVA (500 / 0.99).
This 120 kVA difference represents significant cost savings. A 625 kVA transformer costs approximately 40% more than 500 kVA unit. Installation, cabling, and footprint scale accordingly.
Engineering standards require additional margins. IEEE recommends 125% sizing for continuous loads. The margin applies to the calculated kVA base. Lower baseline kVA from high PF UPS compounds the savings even after margin application.
Transformer losses also favor high power factor. Core losses remain constant. Copper losses vary with current squared. The 19% current reduction from 0.99 PF creates 35% reduction in I²R losses. Transformer operating temperature drops. Efficiency improves. Cooling requirements decrease.
2. Generator Sizing Considerations
Standby generators present stricter constraints than transformers. Generator manufacturers derate output capacity for non-linear loads. Harmonic currents heat alternator windings. Poor power factor strains voltage regulators.
Traditional six-pulse UPS demands 2.5x to 3.0x oversizing. A 500kW load requires 1250-1500 kVA generator. Twelve-pulse systems improve this to 1.5-2.0x. Active PFC UPS achieves 1.0-1.2x sizing factor.
The generator sizing formula incorporates multiple factors:
Generator kVA = (UPS kW / PF) × Harmonic Derating × Recovery Factor
For 0.99 PFC UPS: (500 / 0.99) × 1.05 × 1.1 = 583 kVA
For 0.8 PF 6-pulse: (500 / 0.8) × 2.5 × 1.1 = 1719 kVA
The 1136 kVA difference changes generator selection entirely. Smaller generators cost less to purchase, install, and maintain. Fuel consumption drops. Noise levels decrease. Space requirements shrink.
3. Cable and Breaker Optimization
Electrical codes base conductor sizing on ampacity. Current draw determines wire gauge. Circuit breaker ratings follow current requirements.
Input current calculation: I = P / (√3 × V × PF)
For 400V three-phase systems:
500kW at 0.8 PF: 500,000 / (1.732 × 400 × 0.8) = 902A 500kW at 0.99 PF: 500,000 / (1.732 × 400 × 0.99) = 728A
The 174A reduction permits smaller conductors. Instead of two parallel 500 MCM cables, single 600 MCM suffices. Conduit sizes decrease. Installation labor reduces.
Breaker selection follows similar patterns. 1000A frame breakers cost significantly more than 800A units. Panelboard spaces reduce. Switchgear dimensions shrink.
Voltage drop calculations improve with lower current. For a 50-meter feeder, voltage drop at 902A might require 600 MCM to stay within 2% limits. At 728A, 400 MCM achieves the same result. Copper costs drop proportionally.
Ⅲ. Compliance and Standards Navigation
1. IEEE 519-2014 Requirements
North American facilities must comply with IEEE 519-2014. This standard limits harmonic distortion at the Point of Common Coupling (PCC). The limits vary by voltage level and system strength.
For systems below 69kV (most industrial applications):
- Individual voltage harmonics: ≤ 3%
- Total Voltage THD: ≤ 5%
- Current TDD limits depend on Isc/IL ratio
Six-pulse UPS systems typically exceed these limits. THDi of 30% creates voltage distortion at the PCC. Installations often require passive or active harmonic filters. Filters add cost, complexity, and failure points.
Active PFC UPS maintains THDi below 3% across operating range. Voltage distortion at PCC remains minimal. Most installations achieve compliance without additional filtering. The UPS itself provides clean power characteristics.
Utility interconnection agreements increasingly reference IEEE 519. Non-compliance risks penalties or service refusal. Active PFC technology eliminates these risks proactively.
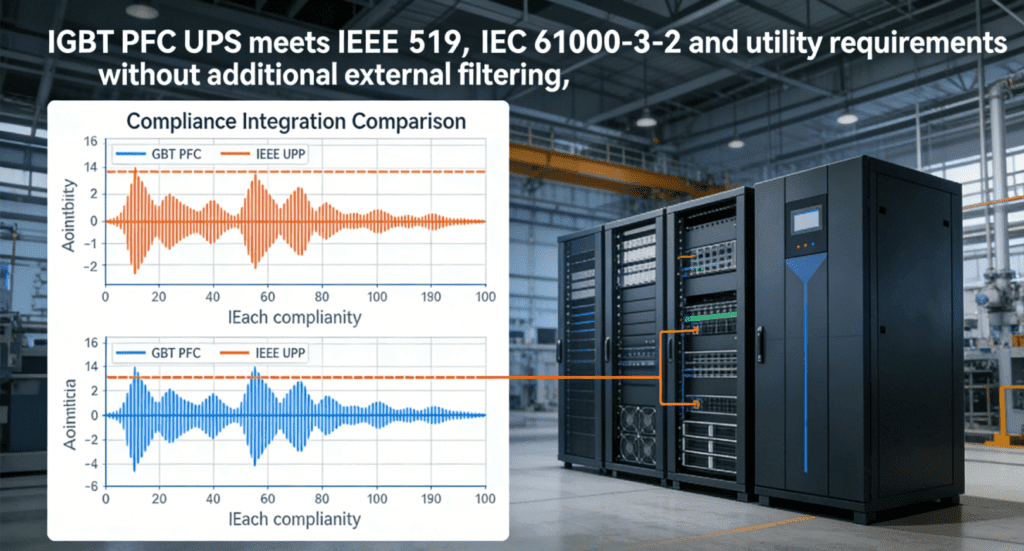
Figure 2: Harmonic compliance comparison showing IGBT PFC UPS meets IEEE 519, IEC 61000-3-2, and utility requirements without additional filtering.
2. International Standards Landscape
European installations follow IEC 61000-3-2 and IEC 61000-3-12. These standards categorize equipment by current draw and application. Class A limits apply to balanced three-phase equipment.
IEC 61000-3-2 Class A limits:
- Odd harmonics (3rd, 5th, 7th): 1.0-2.1A per phase
- Even harmonics: 1.0-0.4A per phase
- THDi effectively limited to 8-10%
Traditional UPS struggles with these limits. Specialized filtering or 12-pulse systems become necessary. Both approaches increase cost and complexity.
Active PFC UPS easily satisfies Class A requirements. The <3% THDi provides substantial margin. Installation documentation simplifies. Compliance testing passes routinely.
Middle Eastern and Asian markets adopt similar standards. Saudi Arabia’s SEC requires <5% THD for loads above 50kVA. China’s GB/T 14549 mirrors IEEE 519 limits. Global consistency favors active PFC adoption.
3. Utility Power Factor Penalties
Many utilities impose power factor penalties. The structure varies by region but generally follows similar patterns.
Typical penalty structure:
- PF 0.95-1.0: No penalty
- PF 0.85-0.94: 1-2% bill increase
- PF 0.80-0.84: 3-5% penalty
- PF <0.80: 5-10% penalty
These penalties apply to total facility power factor. UPS with 0.99 PF improves facility average. This can shift a site from penalty zone to compliance zone.
Some tariffs reward high power factor. Leading PF (capacitive) faces different restrictions than lagging PF (inductive). Active PFC maintains near-unity PF regardless of load. This stability prevents unexpected tariff changes.
Demand charges also favor high PF. Utilities measure peak kVA rather than kW in many regions. Reduced kVA from 0.99 PF directly lowers demand charges. Savings accumulate monthly throughout the UPS lifecycle.
Ⅳ. Industry-Specific Applications
1. Data Center PUE Optimization
Power Usage Effectiveness (PUE) defines data center efficiency. The metric compares total facility power to IT load power. Lower PUE indicates better efficiency.
Typical data center PUE breakdown:
- IT equipment: 67% (PUE baseline)
- Cooling: 30%
- UPS and distribution: 3-5%
- Lighting/other: <2%
UPS efficiency directly impacts PUE. However, UPS input power factor affects infrastructure sizing. Smaller upstream transformers and switchgear reduce distribution losses. The cumulative effect improves overall efficiency.
Consider a 10MW data center. Traditional UPS requires 12.5MVA infrastructure. Active PFC requires 10.1MVA. The 2.4MVA reduction eliminates transformer and cable losses. Estimated 50-100kW savings in distribution alone.
PUE improvement of 0.01-0.02 results from UPS power factor optimization. For large facilities, this represents substantial energy and cost reduction. Operational expenditure drops year after year.
Generator sizing benefits compound the savings. Data centers require N+1 or 2N generator redundancy. Smaller generators from PFC UPS reduce capital cost, fuel storage, and maintenance across redundant units.
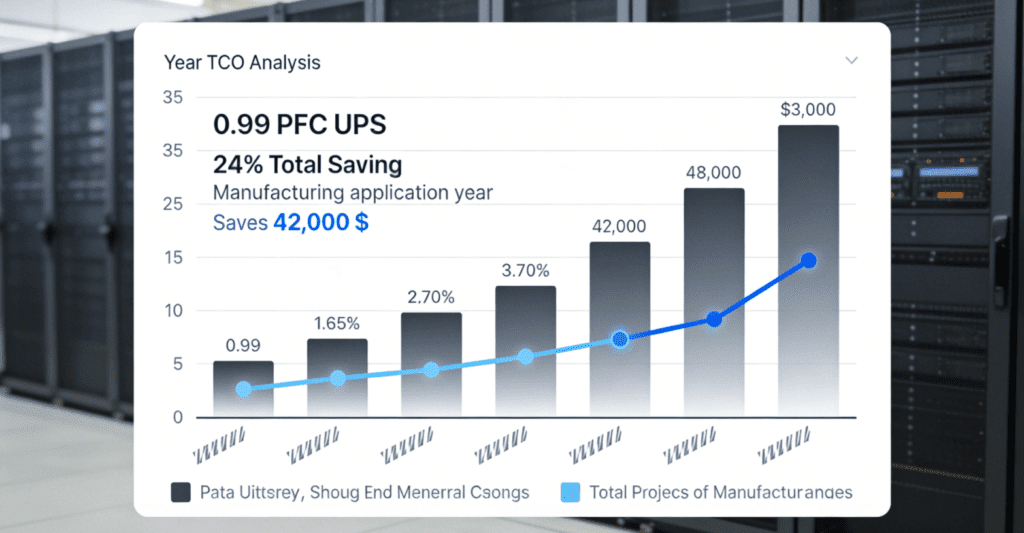
Figure 3: Five-year TCO analysis showing 24% total savings with 0.99 PFC UPS. Manufacturing applications show highest annual savings at $42,000.
2. Manufacturing and Industrial Applications
Manufacturing facilities present complex power quality challenges. Variable frequency drives create harmonics. Welders generate voltage notching. Motors demand high inrush current.
UPS systems in manufacturing protect PLCs, process controls, and critical automation. These loads tolerate minimal downtime. Power quality affects production quality and yield.
Manufacturing case study: Automotive stamping facility
- Load: 800kW mixed critical loads
- Traditional UPS: 1000kVA required
- Active PFC UPS: 808kVA required
- Transformer savings: $45,000
- Annual demand charge savings: $18,000
- Five-year payback: 1.8 years
The facility also avoided power factor penalties. The site previously operated at 0.88 PF facility-wide. UPS with 0.99 PF improved average to 0.94. Penalty elimination saved additional $8,000 annually.
Generator sizing proved critical. The facility lacked space for oversized generators. Active PFC UPS enabled generator installation within existing footprint. Alternative would have required building expansion.
3. Healthcare and Life Safety
Healthcare facilities face unique regulatory requirements. Life safety systems demand continuous power. Electrical codes specify stringent performance criteria.
NEC Article 517 governs healthcare facility electrical systems. Essential electrical systems require reliable power sources. UPS sizing affects generator loading and transfer switching.
Hospital case study: 500-bed regional medical center
- Critical load: 1200kW
- Traditional UPS: 1500kVA, required 1800kVA generator
- Active PFC UPS: 1212kVA, matched 1250kVA existing generator
- Avoided generator replacement: $250,000
The existing generator had sufficient capacity for 0.99 PFC UPS. Traditional UPS would have triggered mandatory generator upgrade per code requirements. Active PFC avoided this capital expense entirely.
IEEE 519 compliance protects sensitive medical equipment. Imaging systems (MRI, CT) require clean power. Active PFC UPS provides both protection and power quality compliance.
Ⅴ. Total Cost of Ownership Analysis
1. Initial Capital Savings
Capital expenses favor active PFC despite higher UPS unit cost. The savings cascade through infrastructure components:
For 1000kW installation:
- UPS unit premium: +$25,000
- Transformer savings: -$35,000
- Generator downsizing: -$80,000
- Cable and conduit: -$15,000
- Switchgear reduction: -$20,000
- Filter elimination: -$10,000
- Net capital savings: $135,000
The UPS premium pays for itself many times over in infrastructure savings. Design teams often overlook these system-level benefits. Total project budget decreases despite premium equipment.
Installation labor also reduces. Smaller cables pull faster. Smaller conduit installs easier. Smaller transformers require less rigging. Schedule compression saves indirect costs.
2. Operational Expenditure Benefits
Annual operating costs favor active PFC significantly:
Energy losses:
- Traditional UPS: 6% of load continuously
- Active PFC UPS: 4% of load continuously
- Difference: 2% of 1000kW = 20kW
- At $0.10/kWh, 8760 hours: $17,520/year
Demand charges:
- Reduced kVA demand: 250 kVA
- At $15/kVA-month: $45,000/year
Power factor penalties:
- Potential penalty avoided: $5000-20,000/year
Total annual savings: $67,520-$82,520
Over 10-year UPS lifecycle: $675,000-$825,000
Maintenance also favors active PFC. No capacitor banks to service. No harmonic filters to monitor. Fewer generator service hours from reduced loading. Maintenance contracts cost less.
Ⅵ. Conclusion
Industrial UPS specification must evolve beyond simple capacity ratings. Input power factor determines infrastructure sizing across the electrical system. Modern 0.99 PFC technology enables right-sizing of transformers, generators, and distribution.
Engineering calculations demonstrate clear advantages. The 19% current reduction from 0.99 PF versus 0.8 PF creates proportional savings in conductors, breakers, and switchgear. Generator sizing factors drop from 2.5x to 1.1x. Transformer capacity requirements shrink dramatically.
Global compliance standards increasingly favor clean power characteristics. IEEE 519, IEC 61000-3-2, and utility tariffs all reward high power factor and low harmonic distortion. Active PFC UPS achieves compliance inherently, without additional filtering or correction equipment.
Total cost of ownership analysis confirms the business case. Despite modest UPS unit premium, system-level savings dominate. Infrastructure cost reductions, operational savings, and compliance assurance create compelling ROI. Payback periods typically measure 1-3 years for industrial applications.
Engineering teams must adopt system-wide thinking. The UPS is not an isolated component. It integrates with transformers, generators, and the utility grid. Active PFC technology optimizes this integration. Specifiers who recognize this will deliver superior projects with lower total cost and higher reliability.
References
- International Electrotechnical Commission (IEC)Official website: www.iec.ch
- Underwriters Laboratories (UL)Official website: www.ul.com
- European Committee for Standardization (CEN)Official website: www.cen.eu
- Standardization Administration of China (SAC)Official website: www.sac.gov.cn
- Zhongguancun Energy Storage Industry Technology Alliance (CNESA)Official website: www.cnESA.org
- International Organization for Standardization (ISO)Official website: www.iso.org